Object Detection: Histogram Of Gradients and Random Forest
Introduction
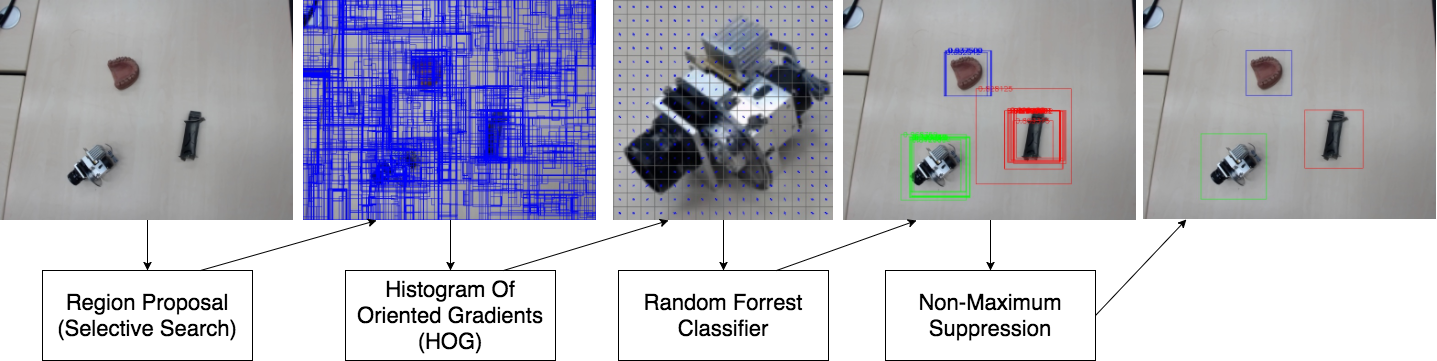
In this article, I introduce a simple/classical object detection pipeline for three classes. We propose regions (i.e. windows) using selective search. For each window, we extract features using Histogram of Oriented Gradients (HOG). Finally, we use random forests to classify those windows and give them confidence. Finally, Non-Maximum Suppression (NMS) is applied to get final bounding boxes. The whole pipeline is built in C++ using OpenCV.
Note that this is a graduate class project conducted in the ‘‘Tracking and Detection in Computer Vision’’ class in the Technical University of Munich (TUM) taught by Dr. Slobodan Ilic.
You could have a look at the Github repository.
Implementation
HOG Descriptor
Dalal and Triggs [1] suggested the stride (block overlap) is fixed at half of the block size. 3×3 blocks of 6×6 pixel cells perform best (with 10.4% miss rate; in the case of human detection). Therefore, we infer the following:
- Block stride is half the block size (i.e. we stride on a cell-by-cell basis).
- Block sizes are 2 (or, 3) times the cell size.
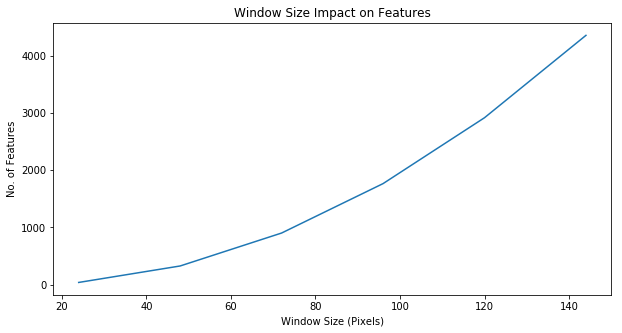
Now, we are experimenting with the window size (and, thus, number of features) as our hyperparameter.
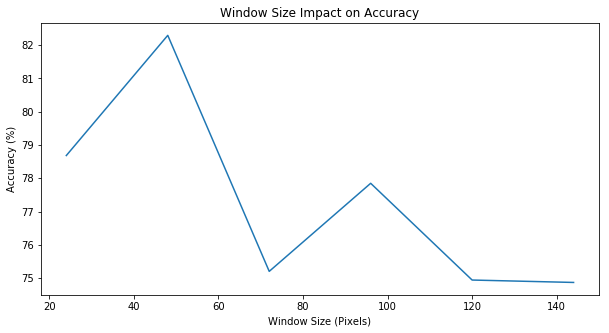 |  |
The best classification accuracy was detected with a window size of pixles, block size of , block stride of and cell size of .
Forest of Random Trees
We used OpenCV’s DTrees decision trees as a building component of our system. Our confidence was a majority vote of all decision trees. Our dataset was imbalanced. Thus, we needed to randomly sample out of each class a number of images that is equivalent to the minimum number of images per class. Now, we have two hyperparameters to experiment with:
- Max. Depth of Decision Trees
- Number of Decision Trees
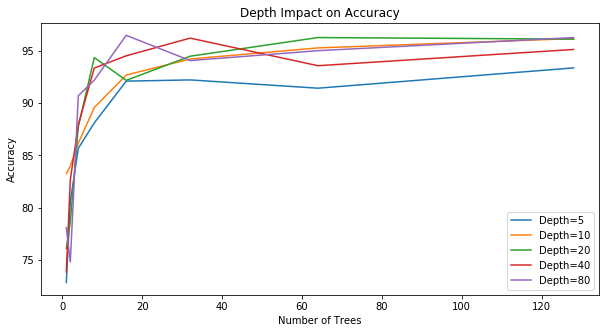 (a) With a higher number of decision trees, a random forrest performance tends to saturate regardless of the depth. | 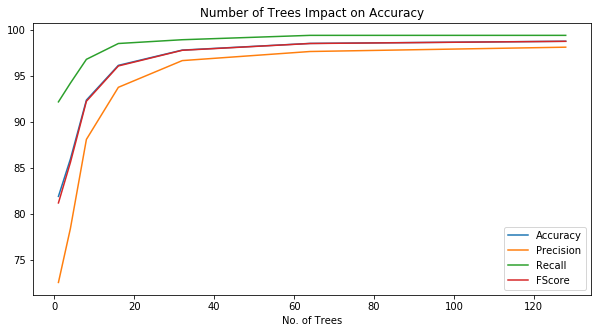 (b) A higher number of decision trees yields in higher accuracy/fscore, precision, and recall. |
According to the above figures, we could see that increasing the number of trees is a key metric to enhancing our accuracy and that depth is a minor hyperparameter. Thus, we stick with the OpenCV default configuration (i.e. a maximum depth of 10).
Window Proposals: Selective Search
At this step, we decided to go with selective search so that we don’t have to build a pyramid of scales. Selective search proposed regions are a bit noisy. Therefore, we need to do the following filtering:
- We exclude all proposals that are bigger than 25% of image area.
- We exclude all proposals that are smaller than 1% of image area.
Finally, given that our training happened on squared images (i.e. with equal dimensions). We needed to square all of the proposed windows. If an image happened to be close to one of borders, we would pad all outlying area (i.e. going over the border outside of the image) with zeros.
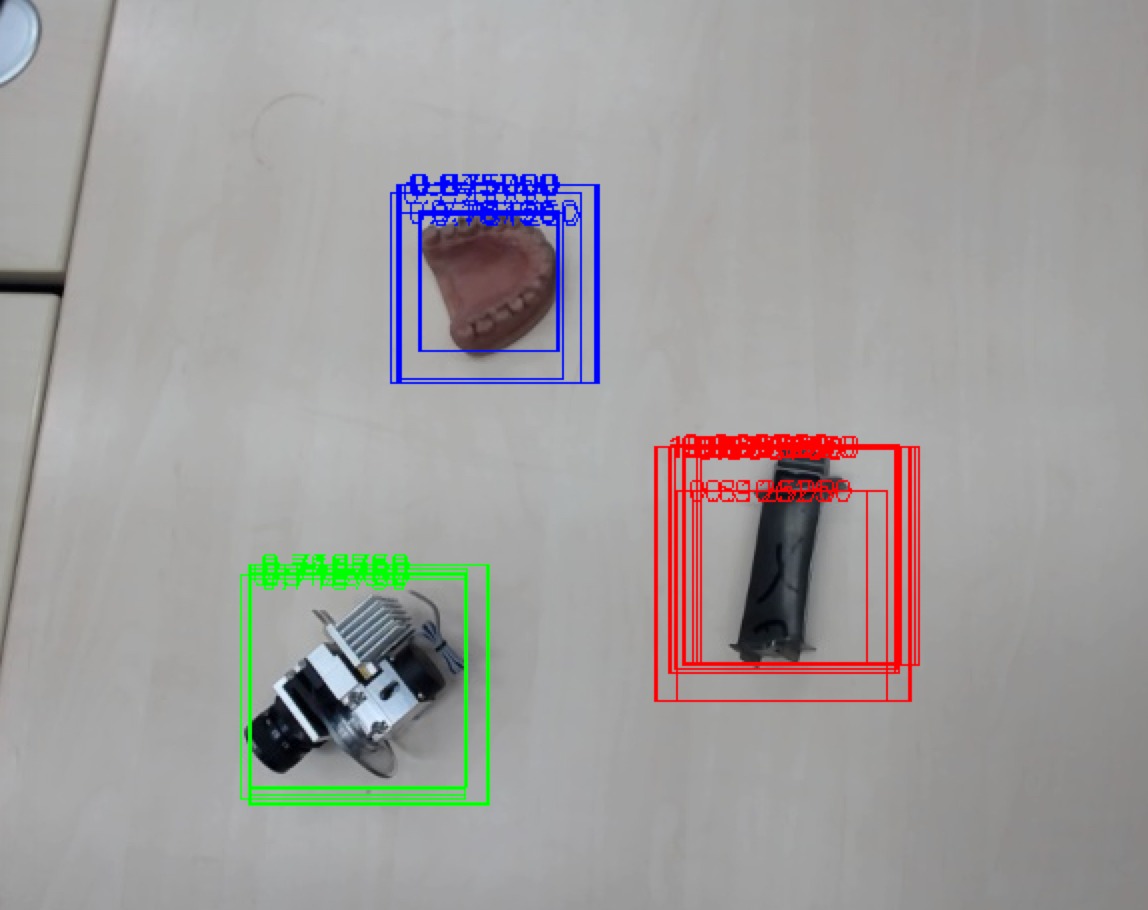
Non-Maximum Suppression
In this step, we suppress all bounding boxes with overlap of 0.3 or greater. The maximum is defined by the classifier’s confidence. The overlap is defined as the Intersection over Union (IoU). However, we could achieve a slight improvement using an intersection over maximum of two areas.
1. Overlap: Intersection Over Union
2. Overlap: Intersection Over Max Area
where and are the areas of the compared bounding boxes.
Results
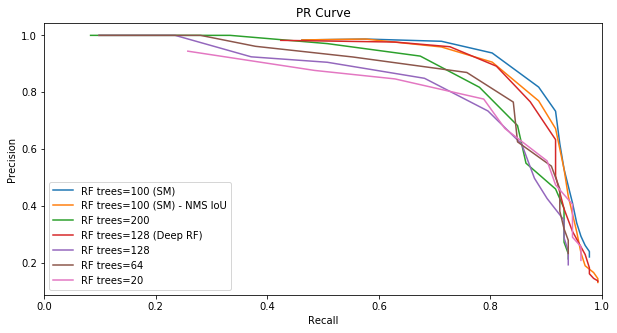
The best performance is achieved by a random forest of 100 decision trees that is trained on hog descriptor of 48x48 window sizes. The other classifiers are trained on 128x128 window sizes and achieved lower results even with higher number of trees. The best curve (the blue one) is obtained using the intersection over max area metric. The second best curve (the orange one) is obtained using the intersection over union curve.
References
- [1]N. Dalal and B. Triggs, “Histograms of oriented gradients for human detection,” in Computer Vision and Pattern Recognition, 2005. CVPR 2005. IEEE Computer Society Conference on, 2005, vol. 1, pp. 886–893.